Antique Item Comparison Strategies: Professional Frameworks for Valuing, Authenticating & Selecting Collectibles
Introduction
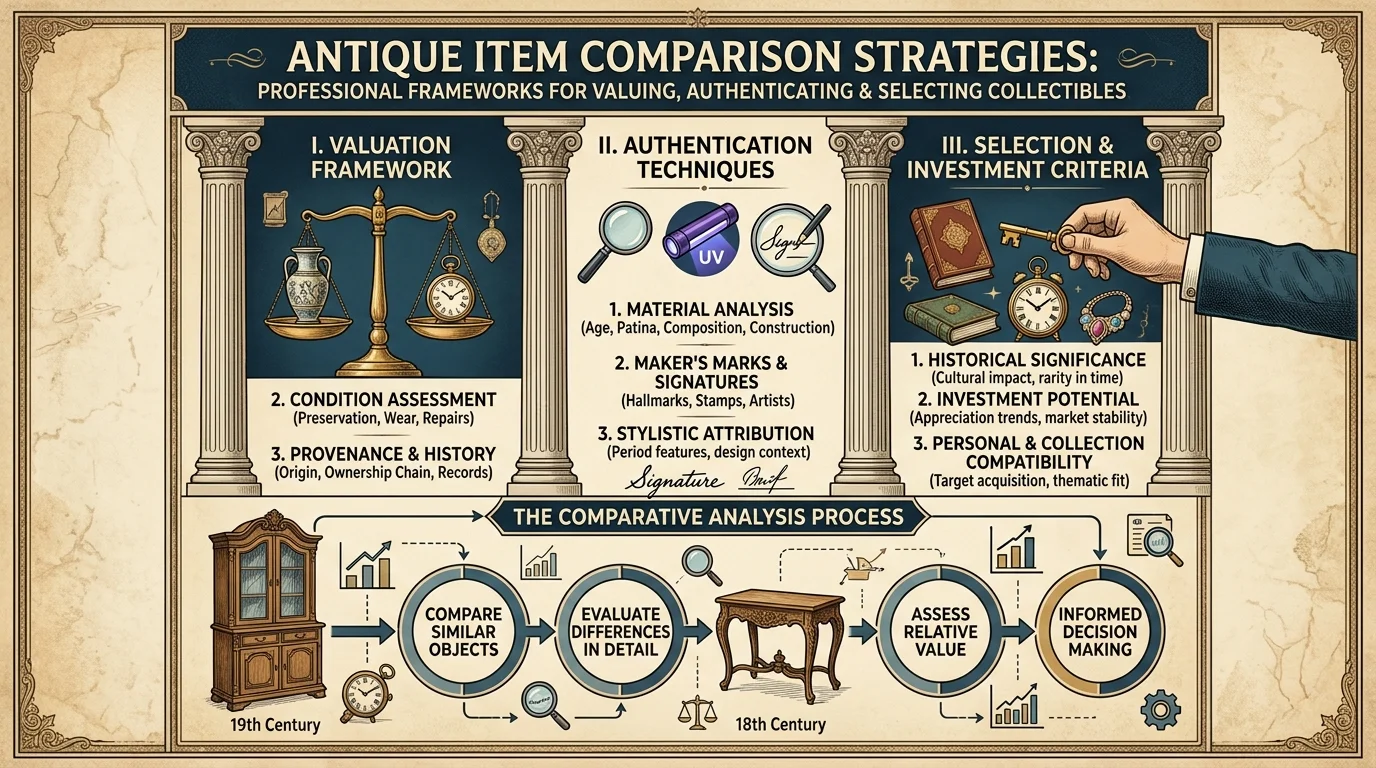
Every antique purchase involves comparison. But amateur collectors compare price alone while professionals compare across seven dimensions: condition, provenance, rarity, period authenticity, material quality, craftsmanship markers, and market trajectory. Antique item comparison strategies separate bargain hunters from value investors. Whether you collect furniture, ceramics, clocks, silverware, or glassware, applying structured comparison frameworks prevents overpaying and identifies undervalued gems. This article delivers the exact checklists, ratio systems, and forensic techniques used by seasoned antique dealers and auction house specialists.
Why Most Collectors Compare Incorrectly
The most common mistake is comparing two superficially similar items without adjusting for condition differentials, regional demand variations, or auction venue premiums. A 19th-century oak dresser sold at a rural estate auction for 400mayappearcheaperthana1,200 equivalent at a London showroom. But the rural example may require $800 in restoration (refinishing, replaced hardware, leg repairs), making the showroom piece the better value. Professional antique item comparison strategies always calculate total ownership cost, not just purchase price.
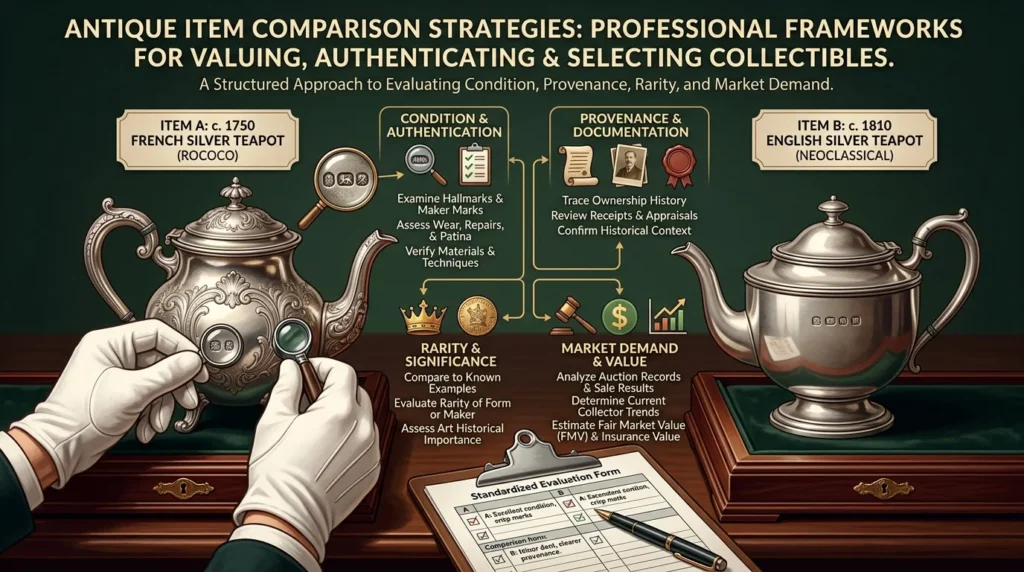
The 7-Point Professional Comparison Framework
| Comparison Dimension | Weight for Valuation | Tools Needed | Red Flag Indicators |
|---|---|---|---|
| Condition & Authenticity | 35% | Loupe, UV light, magnet | Overpainted surfaces, replaced components, non-original hardware |
| Provenance & Documentation | 25% | Archival databases, signed letters | Gaps in ownership, vague attributions (“from an estate”) |
| Maker & Period Specificity | 15% | Reference books (Kovel’s, Miller’s) | “Attributed to” without proof, unmarked pieces |
| Material Quality | 10% | Weight test, wood grain analysis | Modern fasteners, plywood substitution |
| Regional Demand Factor | 8% | LiveAuctioneers regional search | Low bidding activity in item’s origin region |
| Rarity Index | 5% | Completed auction search (last 5 years) | More than 10 identical items sold annually |
| Restoration Cost Projection | 2% | Conservator consultation estimate | Structural issues, active woodworm, cracks |
Strategy 1: Condition-Graded Comparison (Weighted Value Method)
Never compare raw prices. Convert both items to a “Condition-Adjusted Value” using this formula:
Item A price ÷ (Condition grade percentage) = Adjusted comparable value
Standard condition grades with percentages:
- Mint (never used, original packaging): 100%
- Excellent (minimal wear, no damage): 85%
- Very Good (light wear, small cosmetic flaws): 70%
- Good (visible wear, functional but tired): 55%
- Fair (damage present, needs restoration): 40%
- Poor (non-functional, extensive damage): 25%
Example: Two Victorian mahogany chairs. Chair A costs 300inGoodcondition(55300 ÷ 0.55 = 545.ChairBcosts500 in Excellent condition (85%). Adjusted value = 500÷0.85=588. Chair A is actually cheaper on a condition-adjusted basis despite lower raw price.
Strategy 2: Venue-Adjusted Comparison (Auction vs. Dealer vs. Private)
Prices vary dramatically by selling venue. Standard multipliers:
- Estate auction (rural): baseline 1.0x
- Online auction (eBay, LiveAuctioneers): 1.4x
- Antique mall / co-op: 1.8x
- Dedicated antique shop: 2.2x
- High-end showroom / gallery: 3.5x
Comparison rule: Multiply auction price by 1.8 to estimate equivalent dealer price. If a dealer lists an item for 900andthesameitemsoldatauctionfor400 (400x1.8=720), the dealer price is 25% over fair market. Negotiate down or wait for auction.
Strategy 3: Maker Mark and Period Specificity Matrix
| Maker Signature Type | Value Premium Over Unmarked | Verification Difficulty |
|---|---|---|
| Full factory stamp with date code | +150-300% | Low (reference book match) |
| Partial or rubbed mark | +50-100% | Medium (expert consultation) |
| Incised signature (hand-carved) | +80-120% | High (requires handwriting analysis) |
| Paper label (original) | +40-60% | Medium (label aging verification) |
| No mark, attributed by style | 0% (baseline) | Very High (subjective) |
Comparison strategy: When comparing two unmarked items, the one with stronger regional style indicators (e.g., Pennsylvania Dutch motifs vs. generic Victorian) has higher intrinsic value. Document regional features using reference photos from authoritative books.
Strategy 4: Material Quality Forensic Comparison
Advanced collectors use simple scientific tests:
- Silver: Magnetic test (sterling is non-magnetic). Weight comparison (sterling feels heavier than plate). Acid test for hidden areas.
- Wood Furniture: End grain examination (solid wood vs. veneer vs. plywood). Dove-tailed joints indicate pre-1880 construction. Machine-cut joints post-1890.
- Porcelain: Hold to light (translucency indicates high-quality paste). Finger flick test (ringing tone = no cracks).
- Glass: Pontil mark analysis (rough pontil pre-1860, smooth polished pontil 1860-1920, no pontil modern).
Comparison worksheet: Create a material quality score (1-10) for each candidate. The item with higher material quality often outperforms the item with better condition but inferior materials after 10 years of ownership.
Strategy 5: Regional Demand Arbitrage
Antique values fluctuate by geography. A Welsh dresser sells for 60% more in Wales than in London. A Navajo rug achieves triple the price in Arizona versus Maine. A Moorcroft vase brings 40% premium in the UK versus USA.
Implementation: Use LiveAuctioneers advanced search to filter completed auctions by region. Identify items currently listed in low-demand regions. Purchase remotely (with condition reports and third-party inspection), then sell or consign to high-demand region. Profit margin typically 25-50% after shipping and fees.
Strategy 6: Rarity Index Calculation
The Rarity Index = (Number of confirmed surviving examples) ÷ (Years of production) x 100
- Index below 10: Very rare (collectible premium +200%+)
- Index 11-50: Scarce (+50-100%)
- Index 51-200: Limited availability (+10-30%)
- Index above 200: Common (no rarity premium)
How to calculate: Search auction archives (Worthpoint, LiveAuctioneers) for identical items sold in last 10 years. Multiply that number by 5 to estimate total surviving examples (assumes 20% of total examples come to auction per decade). Compare two similar items: the one with lower Rarity Index warrants higher bid.
Strategy 7: Restoration Cost Adjusted Comparison
Always obtain or estimate professional restoration quotes before comparing. Common restoration costs (2025 US averages):
- Re-gluing loose chair joint: $40-75
- Replacing missing veneer (1 square foot): $150-300
- Professional ceramic crack filling (invisible): $200-500 per crack
- Silver replating (teapot): $120-250
- Clock movement overhaul: $180-400
- Oil painting cleaning and relining: $300-1,500
Comparison rule: Subtract estimated restoration cost from the price of the damaged item. Then compare condition-adjusted values. A 200chairwith300 needed restoration has a true cost of 500,makinga450 already-restored chair the better buy.
Advanced Comparison Strategy: The 5-Year Total Ownership Cost Model
Compare two antique candidates using this spreadsheet formula:
Total Cost = Purchase Price + (Annual Insurance x 5) + (Storage Cost x 5) + (Restoration Cost if not done) – (Estimated Appreciation x 5)
Example:
| Factor | Item A (Restored) | Item B (Needs Work) |
|---|---|---|
| Purchase Price | $1,200 | $500 |
| Annual Insurance (1.5% value) | 18x5=90 | 7.50x5=37.50 |
| Storage (climate-controlled) | 100x5=500 | 100x5=500 |
| Restoration Cost | $0 (done) | $400 |
| Estimated Appreciation (8% annually) | -$576 | -$240 |
| 5-Year Total Cost | $1,214 | $1,197.50 |
Items are nearly equal in total cost despite large purchase price difference. Choose based on convenience (Item A) or potential upside if restoration increases value beyond estimate (Item B).
Comparison Mistakes That Destroy Portfolio Value
| Mistake | Impact | Corrective Action |
|---|---|---|
| Comparing only auction hammer prices | +30% hidden fees (buyer’s premium, tax, shipping) | Calculate total invoice price |
| Ignoring period reproduction vs. authentic | 90% value loss on later copies | Learn period-specific construction methods |
| Assuming same maker = same quality | 50% variation within same factory (early vs. late production) | Check serial numbers against factory records |
| Neglecting provincial vs. metropolitan work | Rural pieces often undervalued 40-60% | Buy provincial, sell to city dealers |
| Comparing across different decorative movements | Art Deco vs. Art Nouveau have different demand cycles | Compare only within same movement and decade |
Tools Required for Professional Antique Comparison
- UV longwave flashlight (365nm): Reveals invisible repairs and overpainting
- 10x triplet loupe with scale: Measures wear patterns and maker marks
- Digital calipers: Verifies dimensions against reference books
- Rare earth magnet: Detects iron content (cheap substitutes) in silver or bronze
- Blacklight (254nm shortwave): Identifies modern adhesives and synthetic materials
- Reference library: Kovels’ Antiques & Collectibles Price Guide (updated annually)
- Subscription databases: Worthpoint (25/month)orLiveAuctioneersPro(35/month)
Regional Comparison Tables: When to Buy Where
| Item Type | Buy In (Lower Price) | Sell In (Higher Price) | Typical Spread |
|---|---|---|---|
| American Primitive Furniture | Midwest farm auctions | Coastal design showrooms | 3-4x |
| English Georgian Silver | UK regional auctions | US or Asian collectors | 2-2.5x |
| French Art Glass | French brocantes | Japanese or Korean buyers | 2.5-3x |
| Chinese Export Porcelain | European estate sales | Chinese mainland auctions | 4-6x |
| Italian Mid-Century Lighting | Italian flea markets | NYC or LA galleries | 3-5x |
The 30-Minute On-Site Comparison Checklist
When examining two similar antiques in person:
- Place both on same flat surface under identical lighting
- Photograph all marks, damage, and construction details
- Weigh both (significant weight difference indicates material substitution)
- Measure both (pre-1850 pieces often have slight asymmetry)
- Perform UV test on both (modern fillers glow bright white)
- Smell both (musty = basement storage, chemical = recent cleaning)
- Open all drawers / doors (check for secondary woods)
- Request written condition reports for both
- Ask for provenance documentation
- Walk away and compare photos at home (never decide on-site)
Digital Tools for Remote Comparison
When items are in different locations:
- Use Gigapan or Zoom.photo to share 100-megapixel zoomable images
- Request calibrated color reference (GretagMacbeth ColorChecker) in photos
- Ask for video under moving light (reveals surface texture and repairs)
- Compare both against a known reference standard (e.g., authenticated example from a museum collection database)
Psychology of Comparison: Avoiding Anchoring Bias
Auctioneers know that presenting a high-priced item first “anchors” the buyer’s perception. When comparing two antiques, always research both independently before seeing prices. Write down your independent valuation. Then reveal actual asking prices. If the higher-priced item is closer to your independent valuation than the lower-priced item, buy the higher-priced one. Most overpaying occurs when buyers anchor to the cheaper item and fail to recognize quality differences.
Conclusion
Mastering antique item comparison strategies transforms guesswork into disciplined analysis. Apply condition grading percentages, venue multipliers, maker mark verification, material forensics, regional arbitrage, rarity indices, and restoration cost projections to every purchase decision. Maintain a comparison worksheet for each candidate. Never compare price alone. The professional collector who compares across seven dimensions consistently builds portfolios that outperform those who only compare price tags.
Frequently Asked Questions (FAQs)
Q1: How do I compare two antique chairs when one is marked and one is unmarked?
A: Apply a 50-100% premium to the marked piece depending on maker reputation. Then adjust both for condition using the percentage method. The marked piece usually wins unless condition difference exceeds two full grades.
Q2: What is the single most important factor in antique comparison?
A: Structural integrity. An item with sound original structure but poor finish is restorable. An item with beautiful finish but cracked, warped, or repaired structure is permanently compromised. Always prioritize structure over surface.
Q3: How do I compare items sold at different times (e.g., 2019 vs. 2025)?
A: Use inflation adjustment. Multiply the older price by 1.25 (for 2019 to 2025, average 4.5% annual inflation). Then compare. Also adjust for market segment trends (mid-century modern prices tripled from 2019-2025, while Victorian declined 15%).
Q4: Can I use online price databases as reliable comparison sources?
A: Yes, but with caution. Worthpoint and LiveAuctioneers show actual sold prices including buyer’s premium. eBay completed listings show final bid but not shipping. Always cross-reference three sources. Ignore asking prices (unsold items).
Q5: How do I compare two items from different countries with different collecting cultures?
A: Use the “international auction index.” Search for each item at a major international house (Sotheby’s, Christie’s, Bonhams) sold within the last 2 years. Their global marketing achieves market-clearing prices. Compare those prices directly.
Q6: What is the worst comparison mistake new collectors make?
A: Comparing a restored item to an unrestored item without subtracting restoration cost from the unrestored item’s price. A 300unrestoredchairwith400 restoration cost is actually 700,moreexpensivethana600 restored chair.
Q7: How do I compare a rare but damaged item to a common but perfect item?
A: Rare+Damaged wins for long-term investment (5+ years) if the rarity index is below 20. Common+Perfect wins for immediate display or resale within 2 years. Your time horizon determines the correct comparison outcome.
Q8: Are there any comparison shortcuts that actually work?
A: The “20/80 rule”: 20% of comparison factors predict 80% of long-term value: condition (35% weight), provenance (25% weight), and maker (15% weight). Focus 80% of your comparison effort on these three factors, 20% on all others.